


Double Top: Definition, Patterns, and Use in Trading
Learn about the double top pattern in trading, its definition, characteristics, and how to use it effectively for bearish reversals.

Double Top: Definition, Patterns, and Use in Trading

Introduction
In the world of technical analysis, chart patterns play a crucial role in predicting future price movements. One of the most reliable and frequently observed patterns is the double top. Understanding this pattern can significantly enhance a trader's ability to make informed decisions. This article delves deep into the definition, characteristics, and practical applications of the double top pattern in trading.

What is a Double Top?
Definition
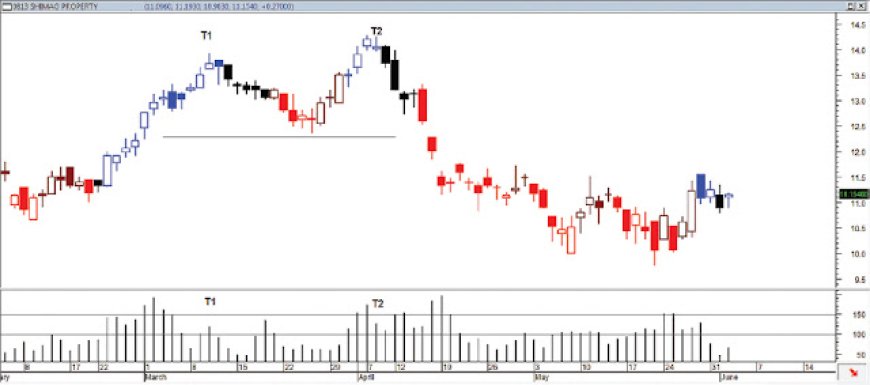
A double top is a bearish reversal pattern that signals a potential change in the direction of a security's price trend. It is characterized by two consecutive peaks at roughly the same price level, separated by a moderate trough. This pattern indicates that the asset has encountered resistance at the same level twice, suggesting that the uptrend may be weakening and a downtrend could be imminent.
Characteristics of a Double Top
Identifying the Double Top
First Peak
.webp)
The formation of a double top begins with the development of the first peak. This peak occurs as the price reaches a new high in an uptrend but then encounters resistance and begins to decline. The decline from the first peak should be significant enough to form a noticeable trough.
Trough Formation
.webp)
After the first peak, the price retraces to form a trough. This trough represents a period of consolidation where the market assesses the strength of the current trend. The depth of the trough can vary, but it should be distinct enough to separate the two peaks.
Second Peak
.webp)
Following the trough, the price rallies again to form the second peak. This peak is typically at a level similar to the first peak. The inability of the price to surpass the previous high indicates the presence of strong resistance.
Neckline
.webp)
The neckline is a horizontal or slightly upward-sloping line drawn through the trough. It acts as a support level, and its break is a critical confirmation of the double top pattern. When the price breaks below the neckline, it signals a bearish reversal and the start of a new downtrend.
Learn How Doji Candle cause Reversal in the market?
Types of Double Top Patterns
Traditional Double Top
The traditional double top pattern is the most common and straightforward type. It consists of two peaks at approximately the same level, with a distinct trough between them. The neckline in this pattern is usually horizontal.
Complex Double Top
A complex double top pattern may involve more than two peaks or have irregularities in the trough. This pattern can still indicate a bearish reversal but may require a more nuanced analysis to identify.
Inverse Double Top
An inverse double top, also known as a double bottom, is a bullish reversal pattern. It is essentially the mirror image of the double top, with two consecutive troughs at roughly the same level, separated by a moderate peak. This pattern suggests that the downtrend is weakening and a new uptrend may be emerging.
Using the Double Top Pattern in Trading
Entry Points
Confirmation of the Pattern
Traders should wait for the price to break below the neckline to confirm the double top pattern. Entering a trade before confirmation can be risky, as the pattern may fail to complete.
Volume Analysis
Volume plays a crucial role in confirming the validity of a double top pattern. An increase in volume during the formation of the peaks and a subsequent decrease during the trough indicates strong selling pressure, supporting the bearish reversal signal.
Setting Price Targets
Measuring the Pattern
The distance between the peaks and the neckline can be used to set a price target. By subtracting this distance from the neckline, traders can estimate the potential decline in price after the pattern is confirmed.
Risk Management
Proper risk management is essential when trading the double top pattern. Setting stop-loss orders above the second peak can help limit potential losses if the pattern fails.
Heading: Exit Strategies
Profit-taking Levels
Traders should set realistic profit-taking levels based on the expected price decline. Monitoring price action and adjusting targets as necessary can maximize profits while minimizing risk.
Trailing Stops
Using trailing stops can help lock in profits as the price moves in favor of the trade. By adjusting the stop level based on market conditions, traders can protect gains while allowing for potential further declines.
Examples of Double Top Patterns
Historical Examples
Stock Market
The double top pattern has been observed in various historical stock market charts. For instance, the 2007-2008 financial crisis saw numerous double top formations in major stock indices, indicating the impending bearish reversal before the market crash.
Forex Market
In the forex market, double top patterns can be seen across different currency pairs. The EUR/USD pair, for example, has exhibited double top formations during significant market reversals, providing traders with valuable entry and exit points.
Real-time Trading
Identifying Double Tops in Real-Time
In real-time trading, identifying double top patterns requires a keen eye and experience. Traders should regularly monitor price charts, use technical analysis tools, and stay updated with market news to spot potential double tops as they form.
Practical Application
Applying the double top pattern in real-time trading involves a disciplined approach. By adhering to entry and exit rules, managing risks effectively, and staying patient, traders can leverage this pattern to enhance their trading performance.
Conclusion
The double top pattern is a powerful tool in a trader's arsenal, providing clear signals for potential bearish reversals. By understanding its definition, characteristics, and practical applications, traders can improve their decision-making process and enhance their profitability. Whether trading stocks, forex, or other financial instruments, the double top pattern remains a reliable and essential component of technical analysis.
Disclaimer: The information provided in this article is for educational purposes only and should not be considered as professional financial advice. Trading and investing in financial markets involve significant risk, and individuals should seek the counsel of a qualified financial advisor before making any investment decisions. The author and publisher are not responsible for any financial losses incurred from the use of the information provided in this article.
Follow Us on Our Social Media platforms.


All the information provided by us is only for educational purposes.
What's Your Reaction?
 Like
0
Like
0
 Dislike
0
Dislike
0
 Love
0
Love
0
 Funny
0
Funny
0
 Angry
0
Angry
0
 Sad
0
Sad
0
 Wow
0
Wow
0


